Plot line labels#
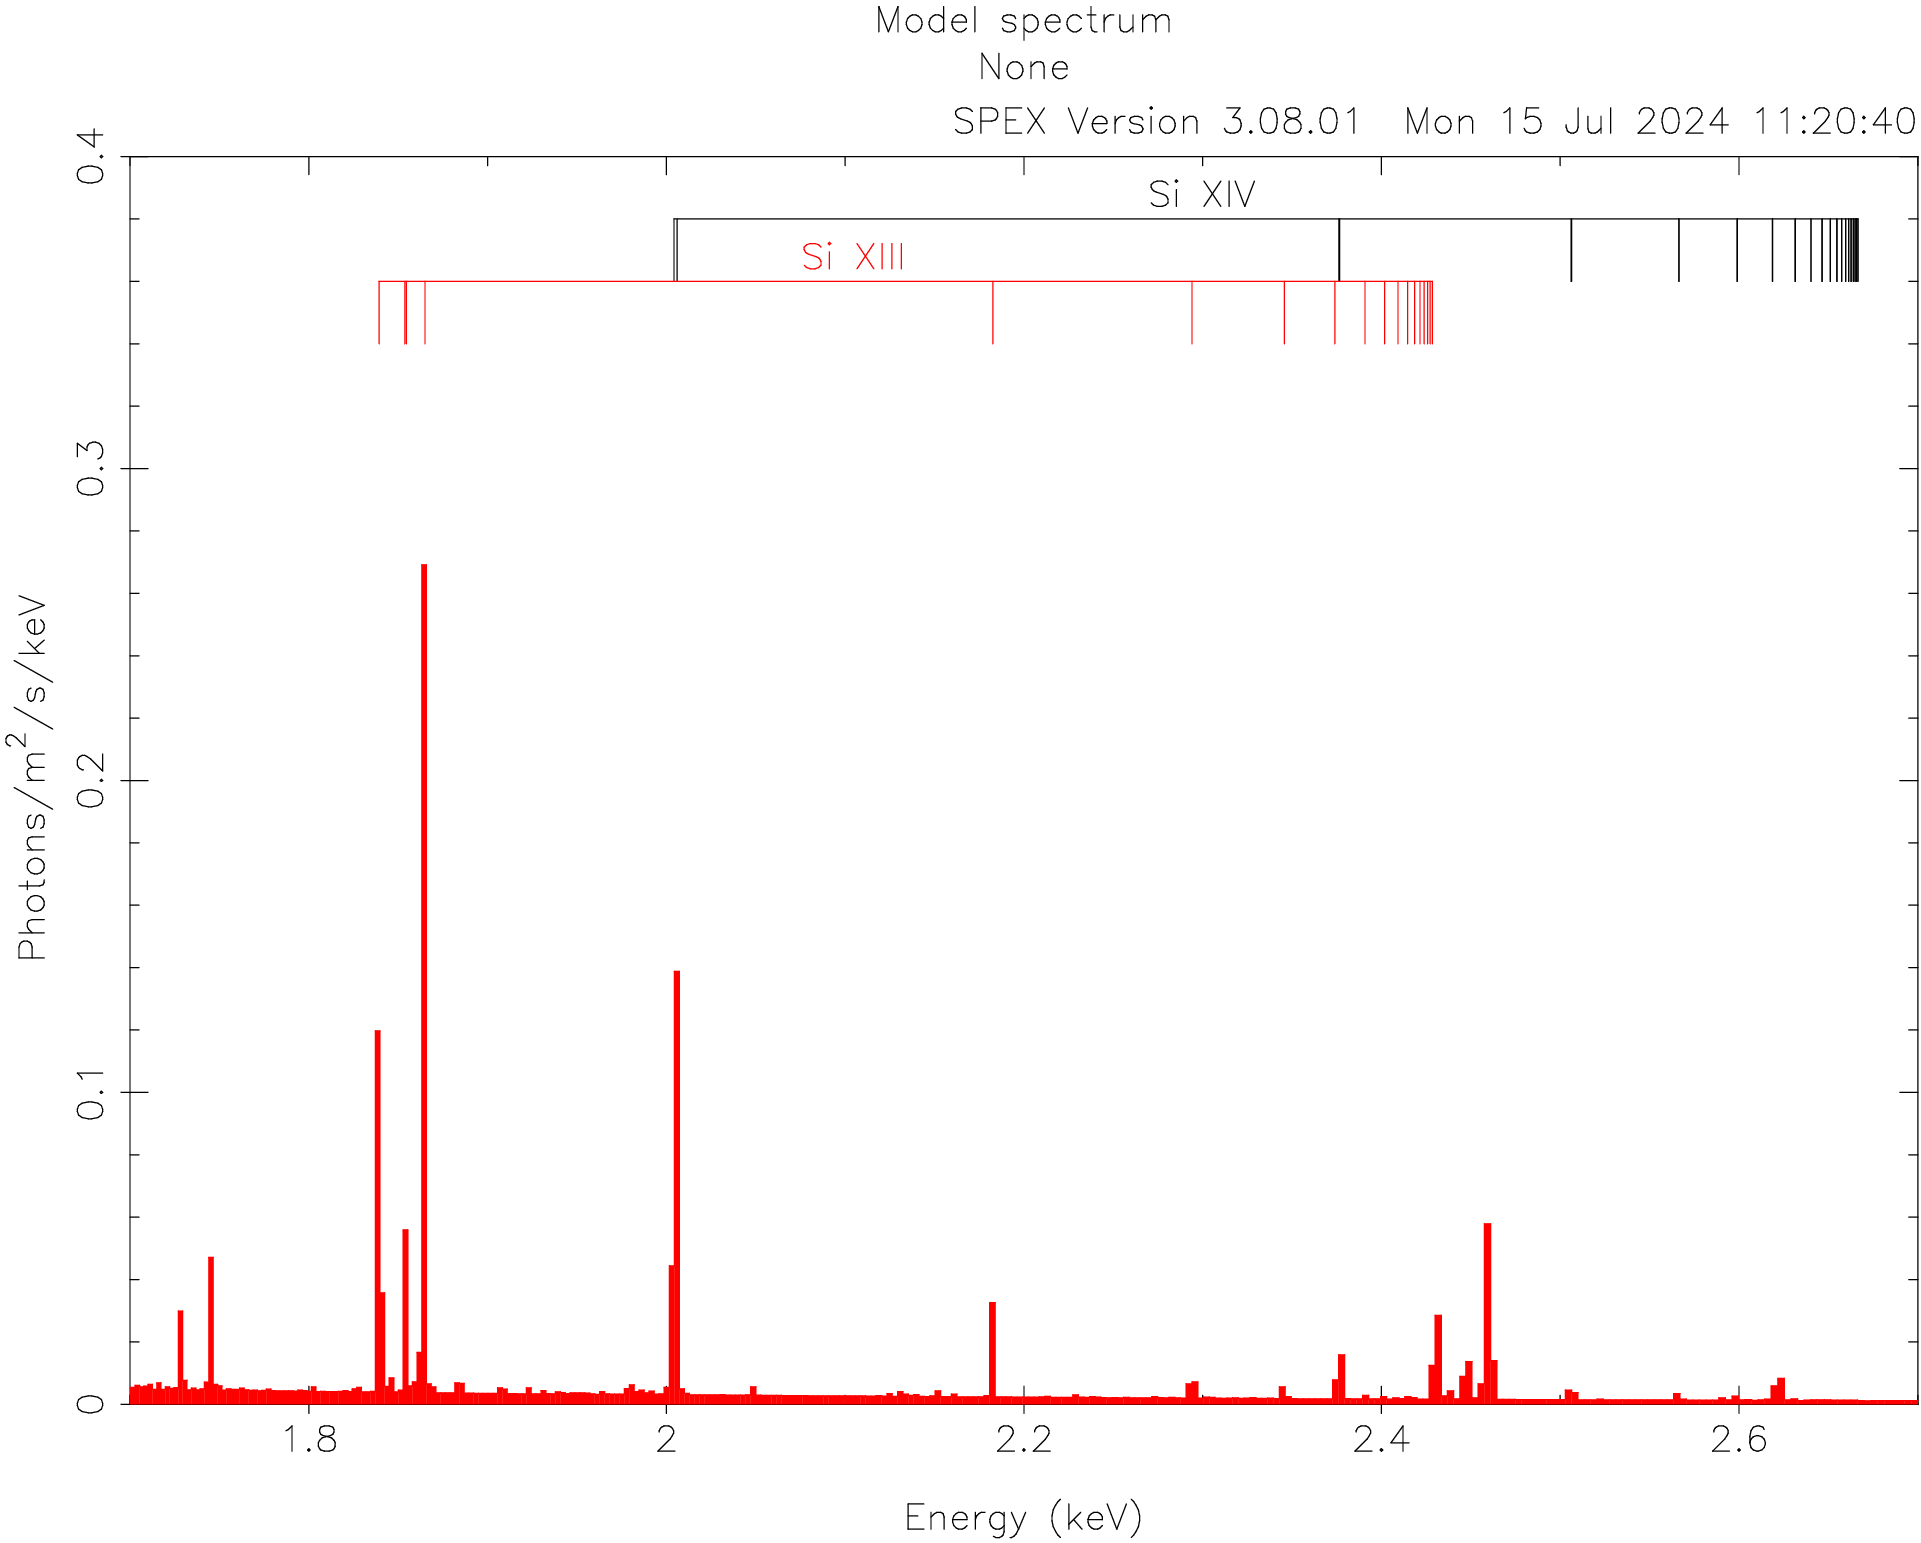
Since SPEX 3.08.01, we have a command to show labels for the strongest lines for an ion. The labels can be added per ion of an element.
Example#
In the figure below, we add line labels for Si XIII and Si XIV on top of a CIE model spectrum using the following SPEX commands:
# First set the model and create the plot
com cie
calc
plot dev xs
plot type model
plot y lin
plot rx 1.7:2.7
plot ry 0.0:0.4
plot

# Add the line labels
plot ion new 14 14
plot ion new 14 13
plot

# See the result in the figure below

# Delete the line labels
plot ion del 1:2